

How to Calculate Critical Values
How to Calculate Critical Values
The critical value is a point on the distribution of the test statistic under the null hypothesis that defines a set of values that call for rejecting the null hypothesis. This set is called critical value or rejection region.
We can say that critical values are boundaries of the acceptance region of the test.
In this article, we discuss the definition of critical value, and how to calculate the critical value with different methods. For better understating also solve some examples.
What is Critical value?
A critical value is defined as the value compared to a test statistic in hypothesis testing to determine whether the null hypothesis is to be rejected or not is called critical value.
Methods of calculating the critical value:
The steps to determine the critical value are the following:
Step 1: subtract the confidence level from 100%. I.e. if 95% is given then 100 – 95 = 5%
Step 2: Convert this value to decimal to get a. Thus a = 5%.
Step 3: if it is a one-tail test then the value of the α remains the same as in step 2 but if the test is two-tail the two-tail is divided by 2.
Step 4: depending upon the test type the critical value can be looked up from the corresponding distribution table using the value of alpha.
Methods of Finding Critical value:
There are four different methods are following:
- T Critical value
- Z Critical value
- F Critical value
- Chi-square Critical Value
T Critical Value:
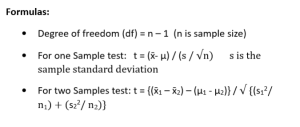
T-Test is used when the same size is given less than 30 and population standard deviation is not given.
It’s also known as Student T Distribution.
These are the following steps for calculating T-Test:
- Find significance level (alpha)
- (n – 1) to find the degree of freedom
- If test is one tail then use one tail distribution table otherwise two tail distribution table.
- Find value from the table (see degree of freedom on the left side and level of significance “alpha’ from the top or row, the intersection is given value)
Decision criteria:
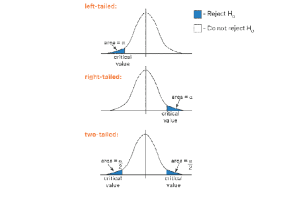
- If the calculated value is greater than the table value then the null hypothesis is rejected for Right tailed test (one-tail test)
- If the calculated value is less than the table value then the null hypothesis is rejected for Left tailed test (one-tail test)
- Reject the null hypothesis if the calculated value does not lie in the acceptance region. (two-tail test)
Z Critical value:
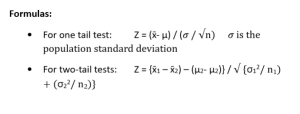
Z test is applied when the sample size is greater than or equal to 30 and population standard deviation is given.
These are the following steps to calculate Z critical value:
- Find the alpha (level of significance)
- Subtract alpha from 1 for one-tail test otherwise subtract alpha from 0.5 for two-tail tests.
- Use Z distribution table to calculate Z critical value
F Critical value:
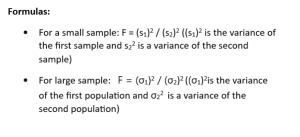
F-test is used to compare the variance of two samples also used in regression analysis.
These are the following Steps of calculate the F critical value:
- Find the level of significance (alpha)
- Subtract 1 from the size of the first sample this is called the first degree of freedom say, x
- Similarly, subtract 1 from the second sample this is called the second degree of freedom say, y
- Using F distribution table to calculate the critical value (intersect x and y rows to obtain value)
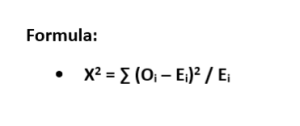
Chi-Square Critical Value:
Chi-square Test is used to compare two variables to see if they are related.
These are the following steps to find Chi square critical value:
- Find alpha (level of significance)
- Subtract 1 from the sample size to find a degree of freedom (df).
- Use a chi-square distribution table to find critical values (intersect row and column)
Examples:
Example 1:
Calculate the critical value for two-tailed tests if a = 0.025 and
Variance = 110, sample size = 41
Variance = 70, sample size = 21
Solution:
Step 1:
n1 = 41, n2 = 21
For n1:
Df = n1 – 1
Df = 41 – 1
Df = 40
For n2:
Df = n2 – 1
Df = 21 – 1
Df = 20
Step 2:
Using F distribution table for the level of significance a = 0.025, the value at the intersection of the 40th column and 20th row is 2.287
Critical value = 2.287
To get rid of these lengthy calculations, you can get help from a critical value calculator and get your answers according to the distribution tables.
Example 2:
With the sample size of 7 at a level of significance alpha = 0.05
Solution:
Step 1:
n = 7
a = 0.05
Step 2:
Df = n – 1
Df = 7 – 1
Df = 6
Using one tail T distribution table at n = 6 and a = 0.05 is 1.943
Critical value = 1.943
Conclusion:
In this article, we have studied the basic introduction to the term critical value and the methods of finding critical value. Further we have disccused its all four methods of finding critical value, T-test, Z test, F test, and chi-square test. Also, we solve examples for better understanding.
You have witnessed that it is not a difficult topic now you can easily solve the problems related to this term.